About
Second year undergraduate at the University of Cambridge studying Computer Science with a particular interest in functional programming languages and environmental computing. You can find out more from my cv
Second year undergraduate at the University of Cambridge studying Computer Science with a particular interest in functional programming languages and environmental computing. You can find out more from my cv
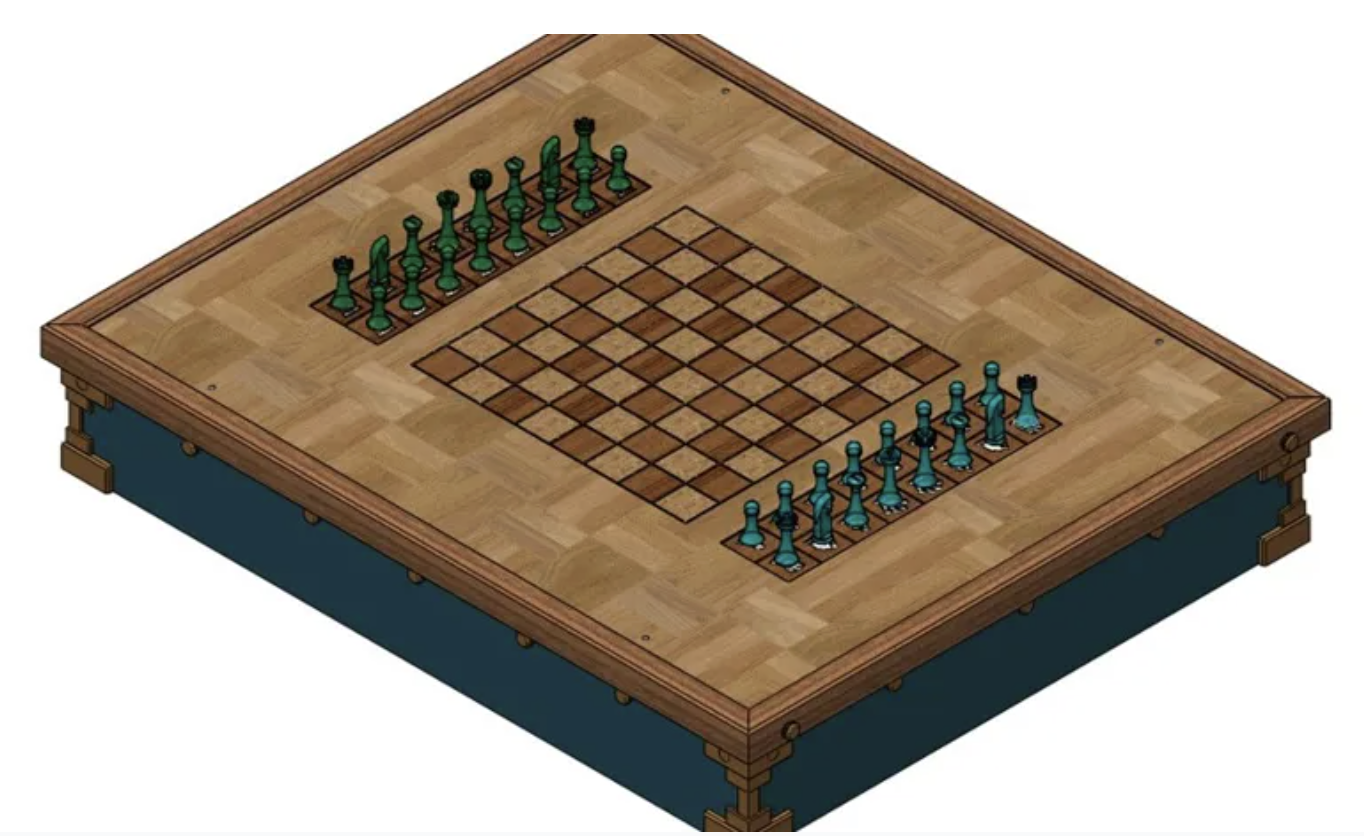
A robot designed to help people with motor disabilities play over the board chess using accessible inputs like eye gaze tracking and voice controls.
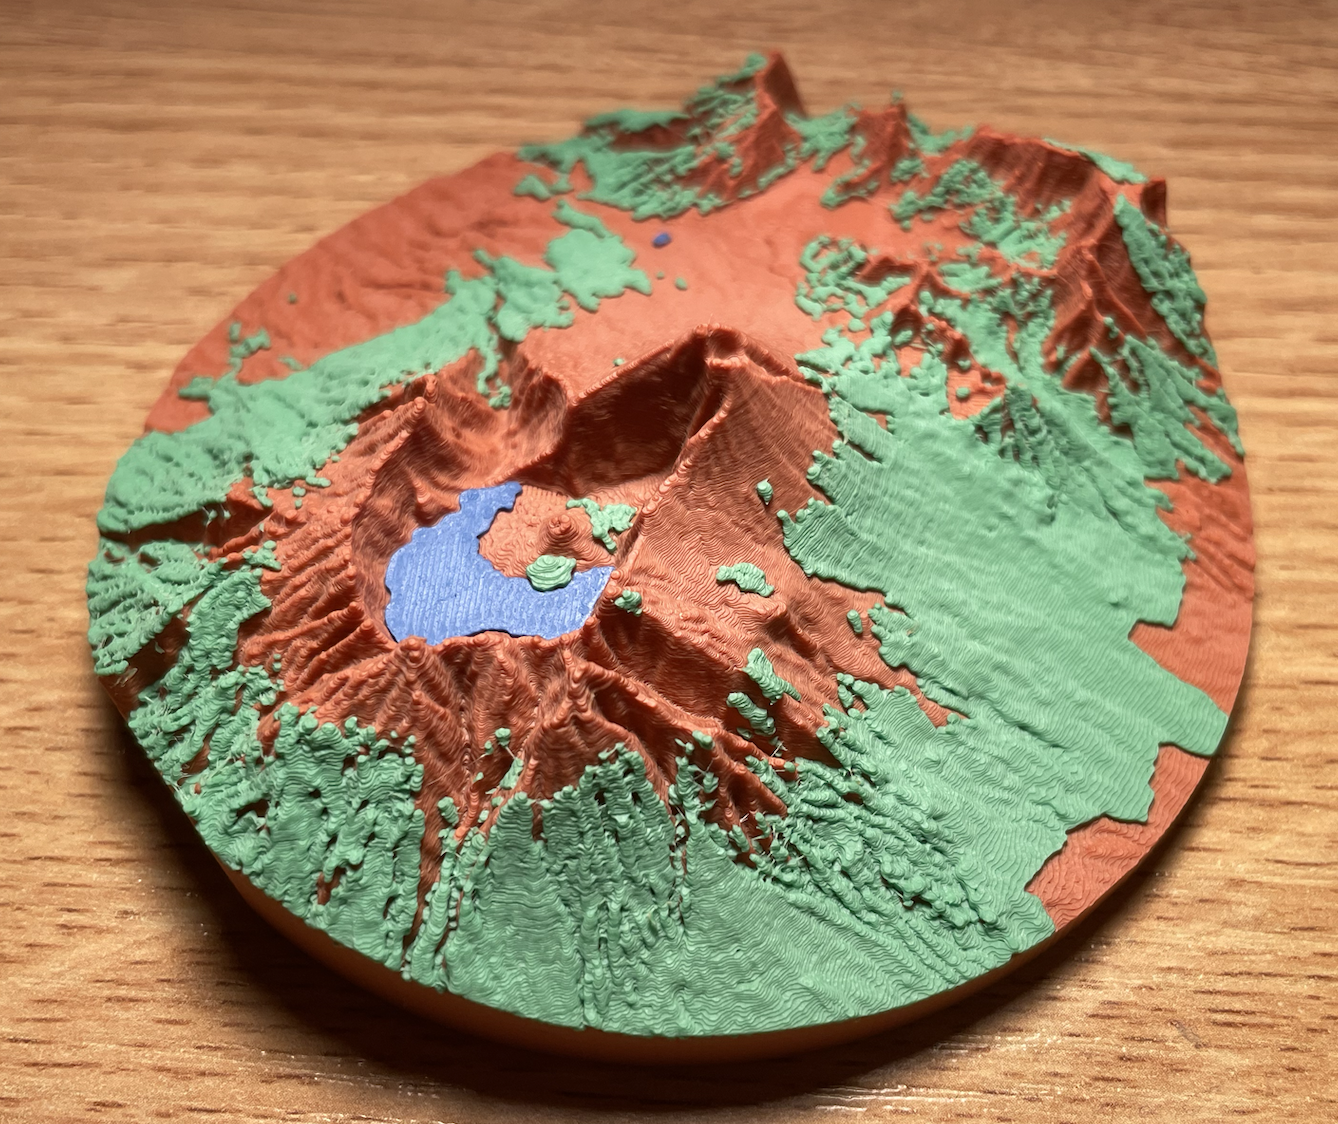
An open source data visualisation tool which uses satelite and OpenStreetMap data to create 3D printable models of cities and terrain
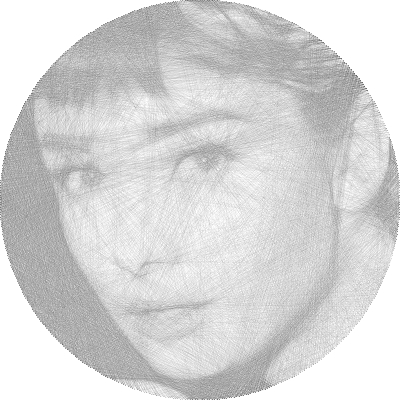
String art is an art technique where you construct an image using only straight lines wrapped around nails on a circular board. In this project I created an algorithm to convert arbitrary images into string art.
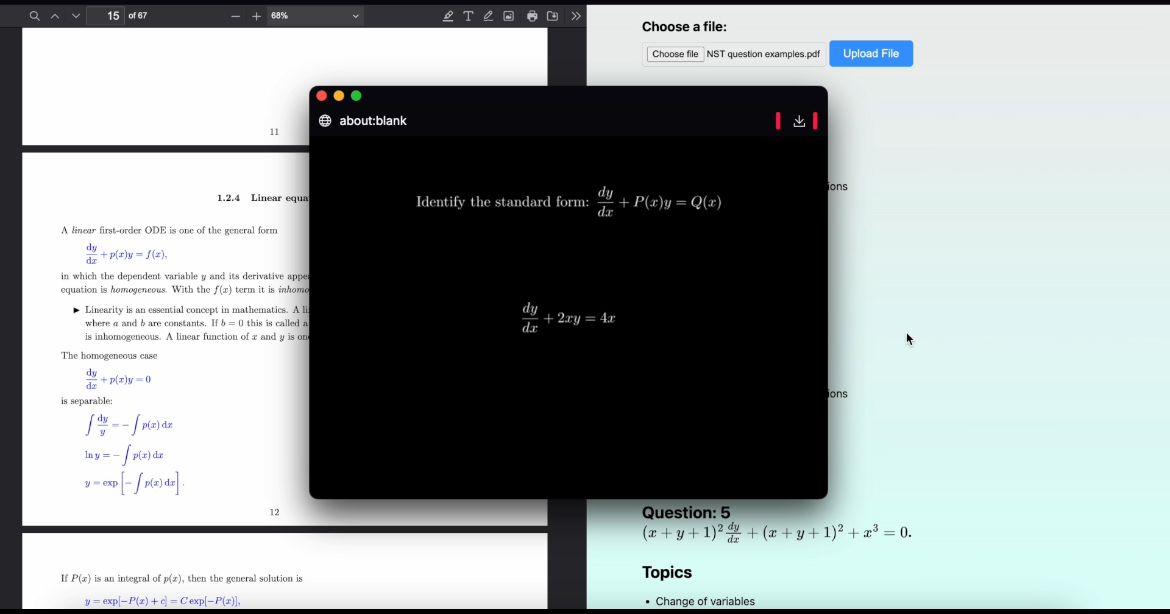
An AI study assistant which procedurally animates mathmatical explanation videos tailered to the users homework questions
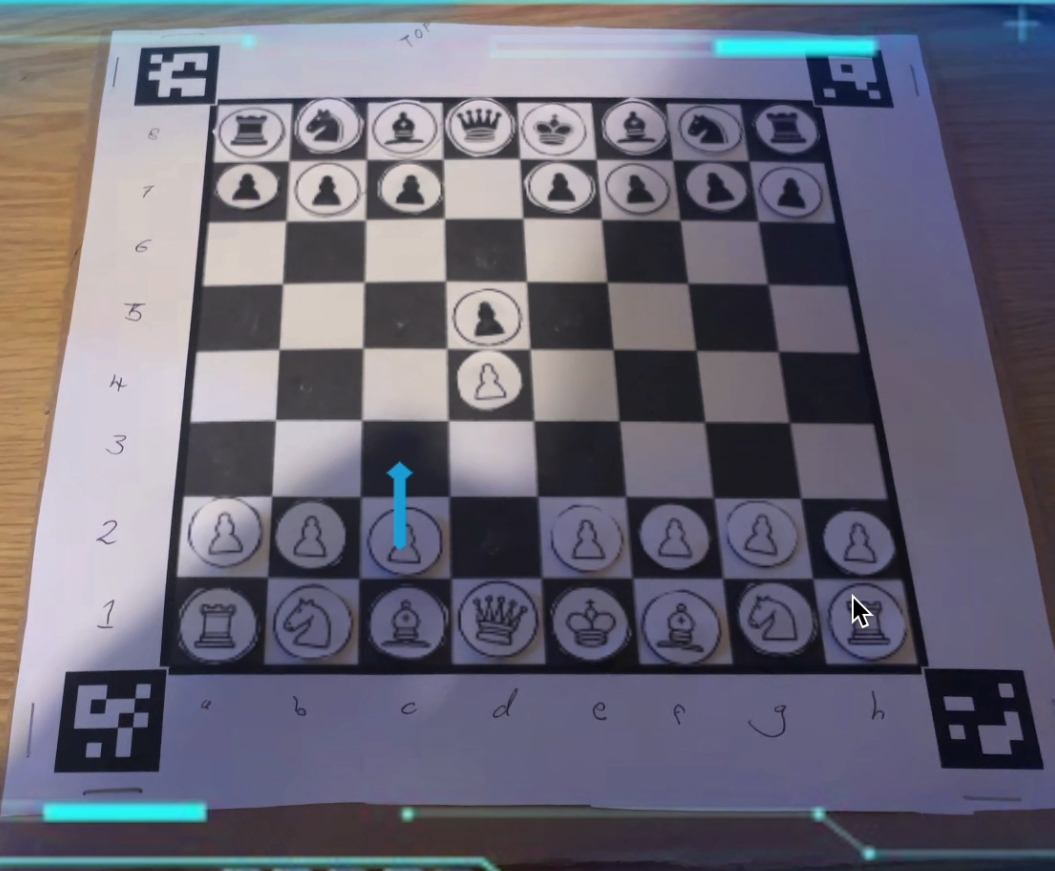
An AR pair of glasses which uses computer vision and machine learning to draw arrows showing the best move in a game of chess