I'm working ahead of schedule, as this week I've completed the following:
- Written the evaluation code: spatial cross-validation, accuracy and macro F1
- Built the data pipeline for Tessera embeddings and habitat labels
- Trained a model for the simple training methods: naive, omniscient and filtered.
For context, the omniscient model refers to the best a model could realistically achieve as it is trained on the synthetic points' 'true' positions (i.e. before any noise is added to the data). This means it serves as a reasonable upper bound on how well the other models recover the map from the uncertainty. The naive method treats the points (now with uncertainties added) as if they are 100% accurate labels for the pixel they are in; this method is the baseline benchmark for future noise-aware models.
However, before I get into all of that, here's a brief section on how representative the New Forest is of the wider iNaturalist data. This was a point raised by Michael and Aneesh in our last meeting and I thought it was worth covering. From what I can tell, within the UK the uncertainty distributions are largely self-similar, whereas for Madagascar there is a notable difference.
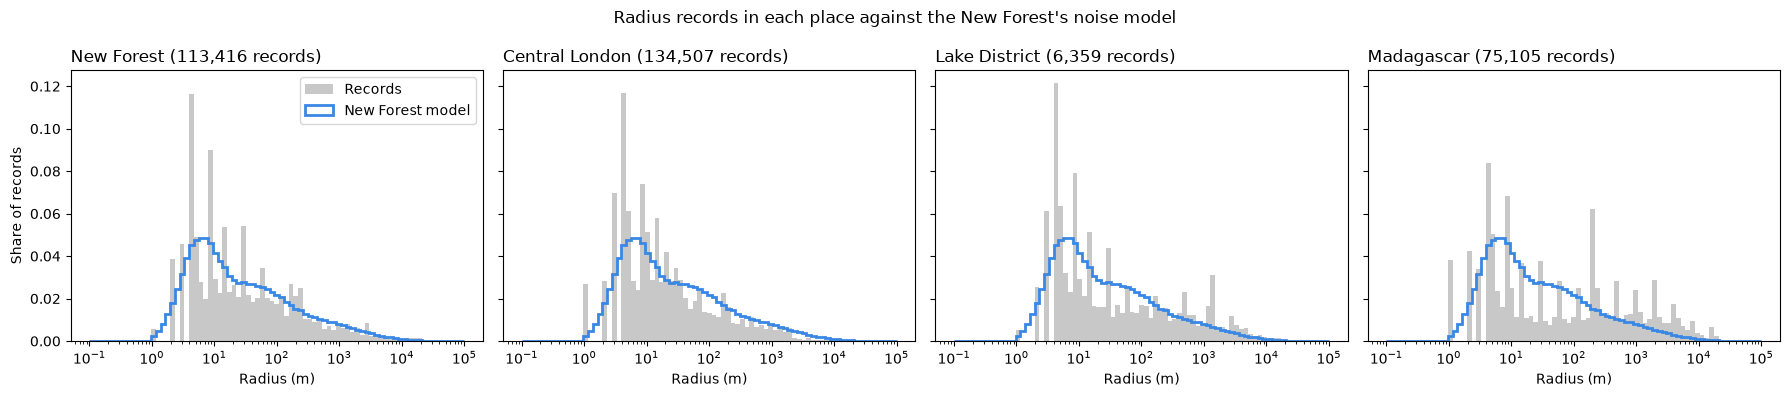
The median radius in Madagascar is 33 m compared to the New Forest's 16 m, which shows that the data is far noisier on average. As the underlying distribution of the noise will disproportionately affect different training techniques, I'll make sure in future to vary the parameters to simulate how the model transfers to different parts of the world.
After implementing the data pipeline for Tessera embeddings and habitat labels, I trained a logistic regression model on both the naive and omniscient data and compared the two using 500 synthetic records.
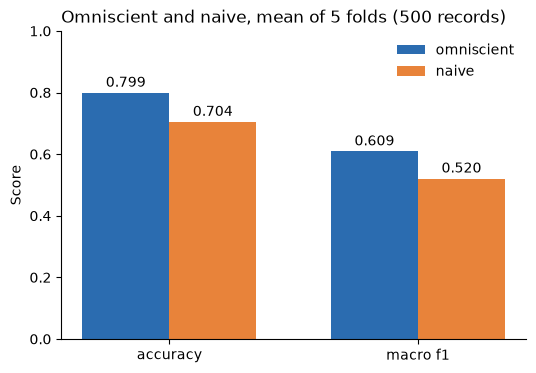
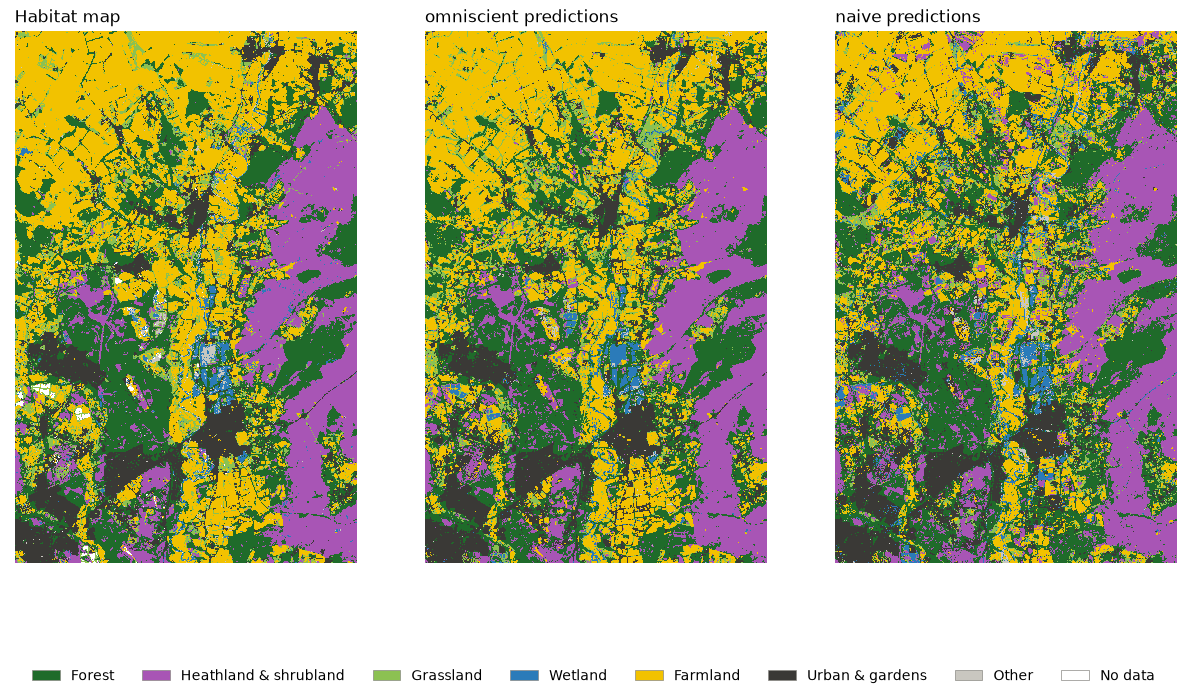
The thing which immediately struck me was how small the gap was between the two methods. When considering that these act as the upper and lower bounds of the future models, it does leave me a little bit concerned that there is potentially not a great deal of improvement to be made. Looking at the maps (because it's always fun to look at maps), at a cursory glance the two appear very similar.
The next point of investigation is to look at the method that a lot of researchers use, which is to simply filter the data to only include the points with very low uncertainty to improve the quality of the labels. To see how well this technique performed, I trained the model for different radius thresholds (where each threshold marked the maximum uncertainty the points could have). Plotting their accuracy and macro F1 scores gave the following graph.
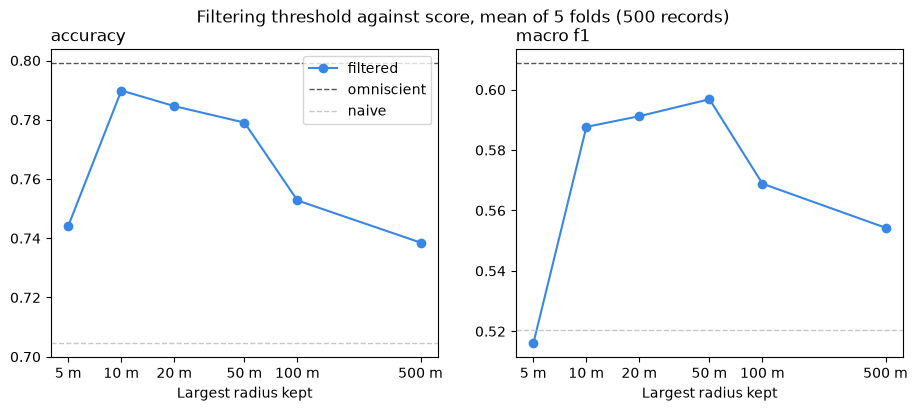
Filtering achieved its best macro F1 score at a threshold of around 50 m, where it was about 1% below the omniscient ceiling. The small gap this leaves for improvement from Multiple Instance Learning leads me to believe that the area of focus should be shifted onto dealing with sparser and noisier data. While I think it is fine for me to continue evaluating the New Forest with this data, as I can artificially degrade the data to see how each technique will scale, when it comes to a practical application, another region (such as Madagascar) might yield more significant results.